高速フーリエ変換(FFT)
FFTは、波形データからどの周期でどのぐらいの振れ幅を持っているかを抽出します。 工学の振動系やノイズが混じった観測データから固有の振動を取り出したりとかに使われます。
pythonのfftモジュールとしては主にしたの3つを使います。
fftn: 波形空間からフーリエ変換した強度空間への射影を行う関数 (n次元で可能)ifftn: フーリエ変換された強度から元の波形空間へ戻す関数 (n次元で可能)fftfreq: フーリエ変換した強度関数がどの周波数に対応しているかの周波数を計算する関数
サンプルデータでFFTの動作確認
サンプルデータ
始めにサンプルの周期的な関数を使って、FFTの動作を確認してみます。
今回はサンプルとして100Hzと350Hzの正弦波を足し合わせた信号を作成します。
振幅は1.5と1とします。
サンプリング周波数は10kHz。サンプル数は256とします。
また外れ値として振幅5のピークを追加します。
import numpy as np
import matplotlib.pyplot as plt

N = 256            # サンプル数
dt = 0.0005          # サンプリング周期 [s]
f1, f2 = 100, 350    # 周波数 [Hz]
a1, a2 = 1.5, 1     # 振幅
png_file = "./fft+SARIMAmodel"

t = np.arange(0, N * dt, dt) # 時間 [s]
x = a1 * np.sin(2 * np.pi * f1 * t) + a2 * np.sin(2 * np.pi * f2 * t) # データ

#ピークを追加
x += np.where(t == 50*dt, 5, 0)

fig, ax = plt.subplots()
ax.plot(t, x)
ax.set_xlabel("Time [s]")
ax.set_ylabel("Signal")
ax.set_xlim(0, 0.1)  # x軸の範囲
ax.set_ylim(-2.5, 5) # y軸の範囲
ax.grid()
plt.savefig(png_file+"sin.png")
plt.show()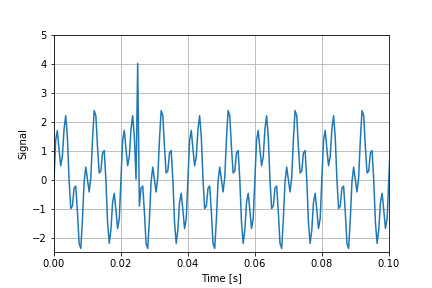
フーリエ変換
サンプルデータをフーリエ変換してみます。
F = np.fft.fftn(x)                       # フーリエ変換
freq = np.fft.fftfreq(N, d=dt)   # 周波数スケール
振幅スペクトルは信号をした結果の絶対値をとったものです。
元の信号との大きさを合わせるために正規化も併せて行います。
サンプルデータ数によって大きさが変わってしまいますのでサンプルデータ数で割る処理です。
またその際 logscale にして表示するのが一般的です。
今回はわかりやすくするため線形scaleで表示します。
# フーリエ変換の結果を正規化
F_ = F / (N / 2)

# 振幅スペクトル
Amp = np.abs(F_)
fig, ax = plt.subplots()
ax.plot(freq[:N//2], Amp[:N//2])
ax.set_xlabel("Frequency [Hz]")
ax.set_ylabel("Amplitude")
#ax.set_yscale('log')
ax.grid()
plt.savefig(png_file+"sin_fft.png")
plt.show()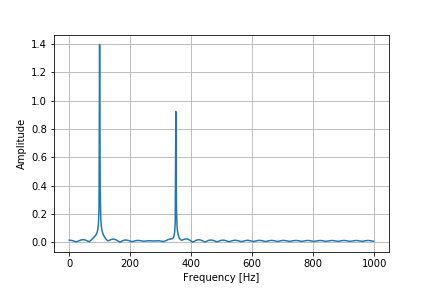
もともとサンプルデータとして振幅1.5周波数100Hzと振幅1周波数350Hzの正弦波を足し合わせておりましたが、このグラフでもぴったり100Hzと350Hzのところにピークが立っていることがわかります。
ただ、振幅に関しては1.4と0.9くらいで若干ずれがありますね。
また、外れ値を入れていたため振幅0のところに揺れがありますね。
逆フーリエ変換
フーリエ空間の波形強度から元の波形空間へ戻すこともできます。これを逆フーリエ変換といいます。 フーリエ変換したあとの情報すべてを使うと、完全に元通りにすることが出来ます。
ただ、元に戻すだけじゃつまらないので、外れ値だった振幅5のピークを含まないように戻したいと思います。ここで使うのがlow pass filterというものです。 FFTした結果のうち, 周波数が一定以下のゆったりとした波形のみをつかって、もとの波形空間に戻すという方法です
threshold_freq = 500  #閾値としている周波数
z_lowpass = np.where(abs(freq) > threshold_freq, 0, F)
x_lowpass = np.fft.ifft(z_lowpass).real

fig, ax = plt.subplots()
ax.plot(t, x, '-', label='Original', alpha=.5)
ax.plot(t, x_lowpass, label='LowPass')
ax.set_title('Low Pass Filter')
ax.legend()
ax.set_xlim(0, 0.1)  # x軸の範囲
ax.set_ylim(-2.5, 5) # y軸の範囲
ax.grid()
plt.savefig(png_file+"sin_low.png")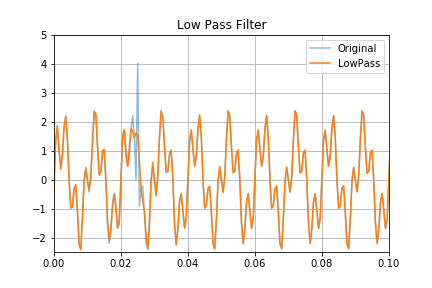
外れ値がしっかりと取り出されていることがわかります。また、サンプルデータとして振幅1.5周波数100Hzと振幅1周波数350Hzの正弦波を足し合わせがしっかりと表現されていますね。
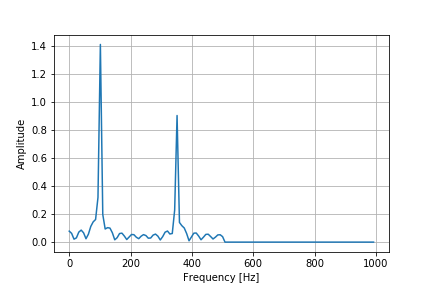
ちなみに今回の逆フーリエ変換使用したフーリエ空間が以下です。
また異常値を見るのであれば、Lowpassフィルタをかけたデータとサンプルデータを引くことで表現できます。
diff = abs(x_lowpass - x)
fig, ax = plt.subplots()
ax.plot(t, diff)
ax.set_xlim(0, 0.1)  # x軸の範囲
ax.set_ylim(-0.1, 5) # y軸の範囲
ax.grid()
plt.savefig(png_file+"sin_low_dif.png")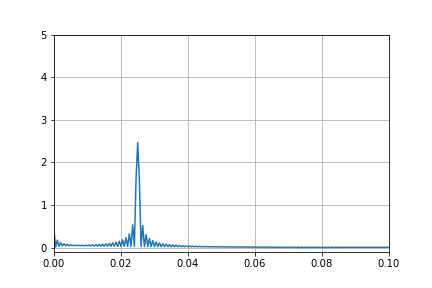
外れ値として振幅5を追加しているのですが、2.5ほどしか除くことができませんでした。。。
fft空間の振幅が0周辺のギザギザが影響しているようです。
FFTを用いた日経平均の分析
日経平均の取得
以上で試したことを日経平均の分析に適用してみましょう。
データは以下のコードから取得します。
import pandas_datareader.data as web
nikkei = web.DataReader("NIKKEI225", "fred", "1949/05/16")

fig, ax = plt.subplots()
ax.plot(nikkei.index,nikkei)
ax.grid()
plt.show()
plt.savefig(png_file+"nikkei.png")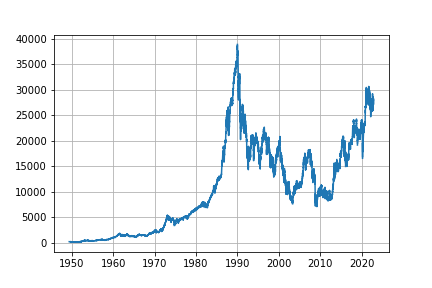
今回は、日経平均をsinの関数を見立てるように
範囲は2016年から2019年に絞って分析したいと思います。
import datetime
nikkei_train = nikkei
nikkei_train= nikkei_train[nikkei_train.index > datetime.datetime(2016, 1, 1)]
nikkei_train= nikkei_train[nikkei_train.index < datetime.datetime(2019, 1, 1)]
nikkei_train= nikkei_train.interpolate()
fig, ax = plt.subplots()
ax.plot(nikkei_train.index,nikkei_train)
ax.grid()
plt.savefig(png_file+"nikkei_train.png")
plt.show()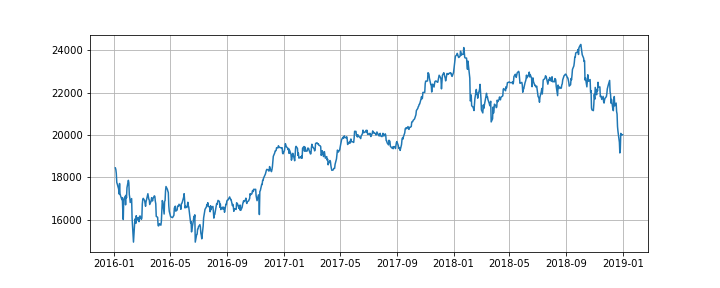
なんとなく-sinの関数に似てなくもない。。。
日経平均をフーリエ変換する
fig, axes = plt.subplots(figsize=(10, 5), ncols=2, sharey=True)
ax = axes[0]
ax.plot(freq[1:int(n / 2)], abs(z[1:int(n / 2)]))
ax.set_yscale('log')
ax.set_xlabel('Frequency [Hz]')
ax.set_ylabel('Amplitude')
ax.grid()
ax = axes[1]
ax.plot(1 / freq[1:int(n / 2)], abs(z[1:int(n / 2)]))
ax.set_yscale('log')
ax.set_xlabel('days')
ax.set_xscale('log')
ax.grid()
plt.savefig(png_file+"nikkei_fft.png")
plt.show()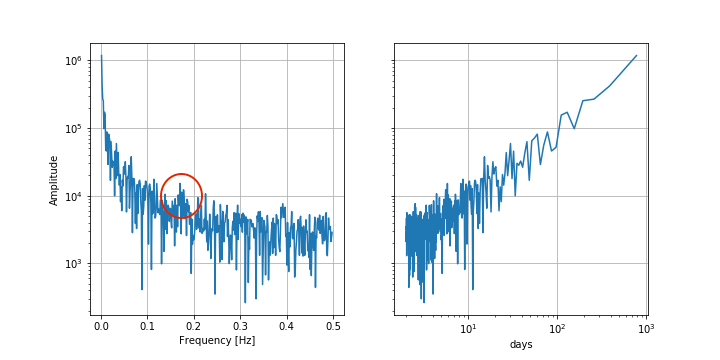
長周期の成分が影響してそうです。大きく平均値が変わるような変動をしているといえます。
そのため、平日や1週間、1ヶ月、1年と言った周期性はないと言える。
かろうじていうと、赤丸のところで少し強いような気もする。
赤丸は5日に当たるところであり、強引に言えば、5日での周期性はあるかも
ただ、lowpassフィルターでは1ヶ月である30日で適用してみる
# 30日以下の周期を無視する様な lowpass
threshold_period = 30
threshold_freq = 1 / threshold_period

z_lowpass = np.where(abs(np.expand_dims(freq, 1)) > threshold_freq, 0, z)
x_lowpass = np.fft.ifftn(z_lowpass).real

fig, axes = plt.subplots(figsize=(10, 8), nrows=2, sharex=True)
ax = axes[0]
ax.plot(t, x, '-', label='Original', alpha=.5)
ax.plot(t, x_lowpass, label='LowPass')
ax.set_title('Low Pass Filter')
ax.legend()
ax.grid()

diff = x_lowpass - x
ax = axes[1]
ax.plot(t, abs(diff))
ax.set_ylabel('diff')
ax.set_xlabel('month')
ax.grid()
fig.tight_layout()
plt.savefig(png_file+"nikkei_ifft.png")
plt.show()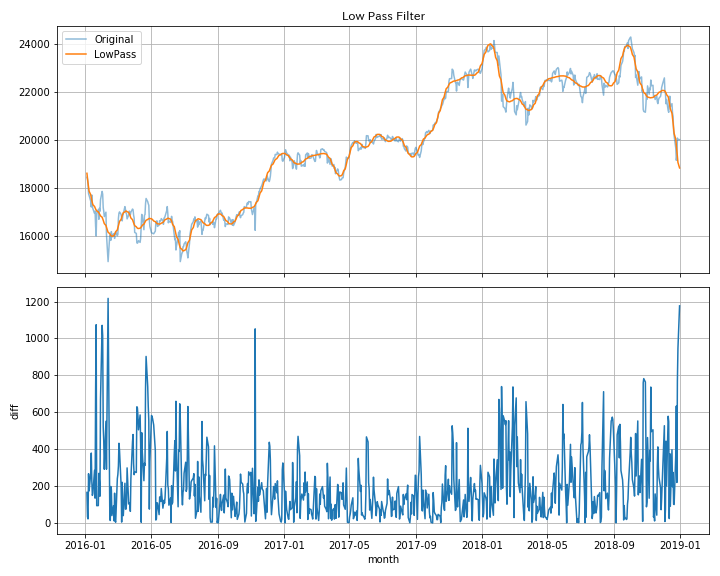
30日以下を無視してもある程度表現できていることがわかる。
SARIMAモデル
SARIMAモデルを説明する前に、ARIMAモデルについて整理します。
ARIMAモデルとは、「autoregressive integrated moving average」の略で、自己回帰モデル(ARモデル)、移動平均モデル(MAモデル)、和分モデル(Iモデル)の3モデルを組み合わせたモデルです。
SARIMAモデルとは、「Seasonal AutoRegressive Integrated Moving Average」の略で、ARIMAモデルに「季節的な周期パターン」を加えたモデルです。
つまり、季節変動があるデータに対してARIMAモデルを拡張した手法が、SARIMAモデルです。具体的には、時系列方向にARIMAモデルを使い、かつ、周期方向にもARIMAモデルを使っているモデルです。
SARIMAモデルでの予測
FFTを用いた日経平均の分析をもとにSARIMAモデルの予測を行いました。
SARIMAモデルのデータ
FFTでは、強いていうなら5日での周期があったため、同じ期間での週ごとの平均を学習データとした。
nikkei_train = nikkei.resample("W").mean()
nikkei_train= nikkei_train[nikkei_train.index > datetime.datetime(2016, 1, 1)]
nikkei_train= nikkei_train[nikkei_train.index < datetime.datetime(2019, 1, 1)]
nikkei_train= nikkei_train.interpolate()
SARIMAモデルの学習
SARIMAモデルの最適化は以下のアルゴリズムを使用しました。
最適化に関しては、BICsが最小になるパラメータを探しています。
また学習は以下のコードを使用しました。
# orderの最適化関数
def selectparameter(DATA, s):
    p = d = q = range(0, 2)
    pdq = list(itertools.product(p, d, q))
    seasonal_pdq = [(x[0], x[1], x[2], s) for x in list(itertools.product(p, d, q))]
    parameters = []
    BICs = np.array([])
    for param in pdq:
        for param_seasonal in seasonal_pdq:
            try:
                mod = sm.tsa.statespace.SARIMAX(DATA,
                                                order=param,
                                                seasonal_order=param_seasonal)
                results = mod.fit()
                parameters.append([param, param_seasonal, results.bic])
                BICs = np.append(BICs, results.bic)
            except:
                continue
    return parameters[np.argmin(BICs)]
import itertools
import statsmodels.api as sm
best_params = selectparameter(nikkei_train, 7)
result = sm.tsa.statespace.SARIMAX(nikkei_train,order=best_params[0], seasonal_order=best_params[1], enforce_stationarity=False, enforce_invertibility=False).fit()推論と考察
この最適化のパラメータをもとに推論を行います。
推論のデータは、2019年から現在(2022年11月)の週平均です。
nikkei_test= nikkei[nikkei.index >= datetime.datetime(2019, 1, 1)]
nikkei_test = nikkei_test.resample("W").mean()
nikkei_test= nikkei_test.interpolate()
SARIMAモデルの推論と可視化を行います。
#推論
train_pred = result.predict()
test_pred = result.forecast(len(nikkei_test))
test_pred_ci = result.get_forecast(len(nikkei_test)).conf_int()
#可視化
fig, ax = plt.subplots()
ax.plot(pd.concat([nikkei_train,nikkei_test], axis=0), label='Original', linestyle="dashed",c="b")
ax.plot(train_pred, label='Predict(train)')
ax.plot(test_pred, label='Predict(test)')
ax.fill_between(
    test_pred_ci.index,
    test_pred_ci.iloc[:, 0],
    test_pred_ci.iloc[:, 1],
    color='k',
    alpha=.2)
ax.legend(loc = 'upper left')
plt.savefig(png_file+"nikkei_sarima.png")
plt.show()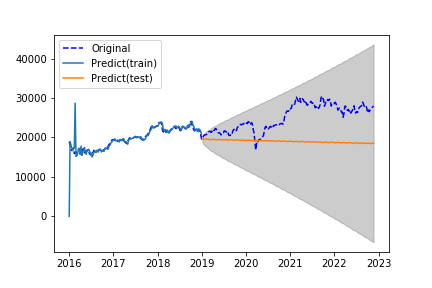
SARIMAモデルの予測値は下降傾向にあるにも関わらず、実数値は上昇傾向にあり予測が上手くいってないことがわかります。
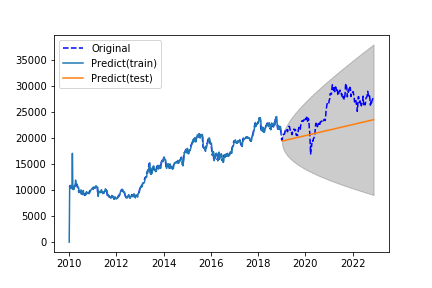
学習データの期間を2010年から2019年に増やして予測を行なってみました。
SARIMAモデルの予測値は上昇傾向になり、実数値と同じ傾向になりました。
以上の結果から、
FFTを用いた分析から日経平均には1年、1ヶ月、1週間といった周期性はあまりないことがわかります。
SARIMAモデルでは、周期性を考慮されず学習モデルの傾向にあった予測になるように感じました。
日経平均の予測には、周期性だけではなく非線形性であったり、外部要因を考慮しないと予測ができないなと感じました。


コメント