初めに
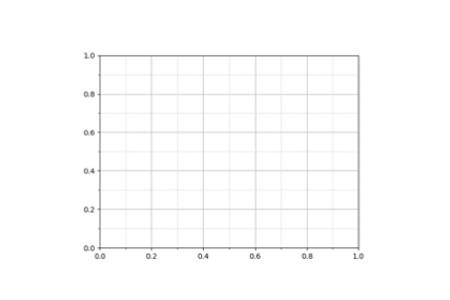
matplotlibで,太い罫線と細い罫線の2種類引いたグラフを出力したい.

方法
以下のコードで罫線入りのグラフが出力できる.
import matplotlib.pyplot as plt


fig, ax = plt.subplots(1, 1)

# minor grid の位置を指定
ax.set_xticks([x / 10 for x in range(1, 10, 2)], minor=True)
ax.set_yticks([y / 10 for y in range(1, 10, 2)], minor=True)

# minorの線を点線にしてみる.+表示.
ax.grid(which='minor', ls=':')

# majorの線を表示
ax.grid(which='major')

plt.show()
公式ドキュメント
Matplotlib(3.5.1)公式ドキュメンテーションには以下のように記載されている(2022年3月現在).
Axes.grid(visible=None, which='major', axis='both', **kwargs)visible: bool or None
Noneかつ他の引数なしの場合は,表示の切り替え.
引数があったら表示.
which: {‘major’, ‘minor’, ‘both’}
グリッド線の選択.
太い方が’major’,細い方が’minor’.
axis: {‘x’, ‘y’, ‘both’}
変更を適用する軸の選択.
**kwargs: Line2D properties
Line2Dの属性.
関連事項
ticks(髭)について(未リンク)
ラベルについて(未リンク)
Line2D


コメント